
 |  |  |  |  |
|---|---|---|---|---|
 |  |  |  |  |
 |  |  |  |  |
 |  |  |
Our private lives / Lella Secor Florence. London: George G. Harrap & Company, 1944
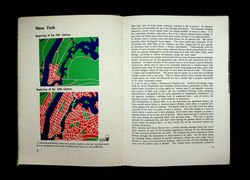
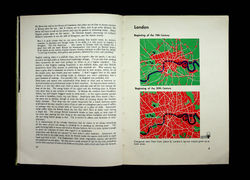
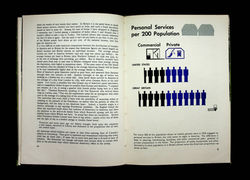
“Some Isotype charts present a single data story but many of them are folding in multiple types or categories of data to create it. An obvious example can be seen both as a color change in a row of the same icon or as different rows of different icons. A definitive “rule” was not set by the team but rather becomes one of a set of approaches which are then tested with the audience for understandability.
This simple feat of calculation and grouping of the data is deceptively difficult and the Isotype Institute found many ways to incorporate various types of data in a single chart.”
Jason Forrest. Exploring Isotype Charts: “Our private lives.” Nightingale: the journal of the Data Visualization Society, February 26, 2020. https://medium.com/nightingale/exploring-isotype-charts-our-private-lives-part-2-a3aa51c7b08f